
Statistics on the use of animals in research
Please also see the Norwegian-language version of this page.
The Food Safety Authority's annual reports on animal use in research and testing
Report on animal use in Norway from 2018 to 2023
Norecopa, in collaboration with the Swiss 3R Competence Centre and with a grant from the Norwegian Animal Protection Alliance's Research Fund, has written a report presenting Norway's official statistics for animal use during the six years of 2018 to 2023. The work was funded by the Research Fund of the Norwegian Animal Protection Alliance (Dyrevernalliansen).
The Report may be downloaded here:
Champetier A, Smith A & Vuille S (2025): Research animal use in Norway from 2018 to 2023: A presentation of the official statistics with emphasis on large studies. 54 pages. ISBN: 978-82-693192-1-7.
The main conclusions were:
-
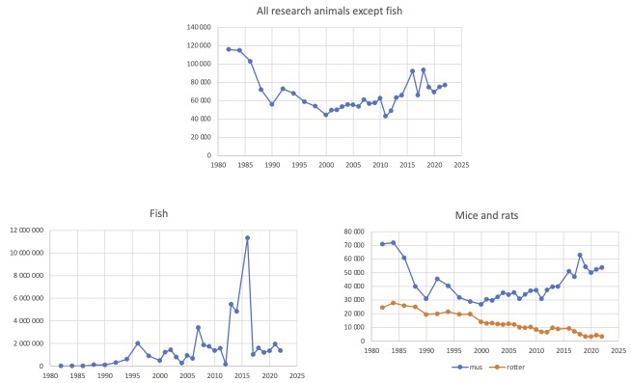
On average, Norway used 1.5 million animals per year in this period (range 1 281 595 – 2 008 625), for a total of 3 104 projects.
-
There are no consistent trends over the six years for the total number of animals used in Norway, or for the relative occurrence of the four categories of severity.
-
Single large projects on fish continue to be the main factor affecting the national statistics, making it difficult to identify real trends. These year-to-year variations of several hundreds of thousands of procedures were driven by the timing of the projects, and were most often related to Atlantic Salmon and its commercial production, especially in relation to the management of lice.
-
There were large year-to-year variations in the severity of procedures. These too were driven by very large projects involving salmon and other fish. For laboratory species, the severity of procedures tended on average to be higher for zebra fish than for mice, these two species being the main laboratory species in Norway.
-
The number of mice used for the most severe procedures is small, while the numbers of those used for mild and moderately severe procedures fluctuated, with a tendency during the last three years towards the mild category.
-
Batch testing and other regulatory and quality control procedures are among the uses where severity is highest for fish. The statistics for 2021 and the following two years show signs of a decline in absolute numbers, but not of a general decline in severity.
-
There is very limited reuse of research animals in Norway, in keeping with the conditions expressed in both EU and Norwegian legislation
-
The work of studying the use of animals in Norway for scientific purposes should continue, in close collaboration with the scientists, to gain more insight into possibilities for further implementation of the Three Rs (Replacement, Reduction, Refinement).
EU databases
The databases produced by the EU are described on this page:
- In 2021 the EU Commission launched their ALURES Statistical EU Database, with statistics for the use of animals in research and testing in the EU and (from 2018) Norway. ALURES currently allows searches at the EU level, but as from the data for 2021 it will be soon (2024) be possible to search through national figures as well.
- In addition, the Commission has launched its ALURES NTS Database, with Non-Technical Project Summaries (NTS) of approved projects.
Until the end of 2020, Member States were required to publish NTS at national level. For projects authorised after January 2021, NTS are published in the ALURES NTS Database.
EU Member State reports
Collections of historical reports from the individual member states are available here. These are soon to be included in the ALURES Statistical EU Database (see above).
A list of national websites hosting NTS published before 2020 is available on the EU website.
Norwegian database
The Norwegian Food Safety Authority's own database of summaries of approved applications for animal research and testing is available here.
Historical information about Norway
Until mid-2015, animal research in Norway was controlled by the Norwegian Animal Research Authority, NARA (Forsøksdyrutvalget, FDU), a section under the the Norwegian Food Safety Authority (Mattilsynet). NARA published annual reports up to and including a report for 2013, which until recently were available on http://www.mattilsynet.no/fdu/om/arsrapporter. This webpage has been removed and at present there are few statistics available on the new Animal Research section of the Food Safety Authority's website. Norecopa has collected the annual reports from NARA (written in Norwegian only), see below.
Based upon figures from the Food Safety Authority
Norway's statistics:
2019
2018
For the first time, Norwegian statistics (for 2018) were included in the EU Commission's Report which was published in July 2021. This is a result of Norway's transposition of the EU Directive 2010/63. More information is available here.
2015 (page 93 in the annual report from the Food Safety Authority for 2016; see also their rapport for 2015)
2014 (no figures available according to page 40 in the annual report from the Food Safety Authority, but some figures are available in their report for 2016, page 93)
2012 (preliminary statistics only, no report written)
2000 (statistics only)
1999 (statistics only)
1998 (statistics only)
1997 (statistics only)
1996 (statistics only)
1995 (statistics only)
For comparison, figures from:
- The Home Office, UK
- The Council of Europe (click on Statistics)
- Speaking of Research: statistics on animal use in countries worldwide
- Infographic from Understanding Animal Research for the EU 2022 statistics
Other references
- Estimates of the international use of animals in research and testing (from Understanding Animal Research)
- Taylor (2024): Trends in the Use of Animals and Non-Animal Methods Over the Last 20 Years
- Figuring it out: questions of comparison, culture and care in animal use statistics (opinion piece by Gail Davies, AnNex, c. 2014)
- A Summary of EU National Statistical Reports of Animal Experiments in 2014-2016 (Letter to the ALTEX journal, 36(2), 2019)
- New European Statistics on Laboratory Animal Use - What Really Counts! (Busquet et al., 2020), an opinion piece on the EU statistics released in February 2020 for 2015-2017).
- An Estimate of the Number of Animals Used for Scientific Purposes Worldwide in 2015 (Taylor & Alvarez, 2020)
Thanks for your feedback! Please note that we cannot reply to you unless you send us an email.
What are you looking for?
We value your feedback so we can improve the information on the page. Please add your email address if you would like a reply. Thank you in advance for your help.!
Please contact us by email if you have any questions.